
Reports and proposals · May 9, 2002
Dun and Bradstreet marketplace expenditure analysis
County-hosted consumer-spending analysis with methodology. The values are modeled estimates, not City finances.
Text
Transcribed from the scans and checked against them by Claude. Typed text comes first; handwritten notes follow it. [illegible] marks words that cannot be read and [?] an uncertain reading.
Page 1
arketplace Analysis Report http://www.colapublib.org/libs/hermosa/market1.html
About the Library
Calendar & Events
Career Opportunities
Library Services
Librarian's Bookshelf
Materials Collections
Support Groups
FYI Research Services
Community History
Community Libraries
Children's Services
Catalog
Search Our Site
Explore the Web
Community Libraries
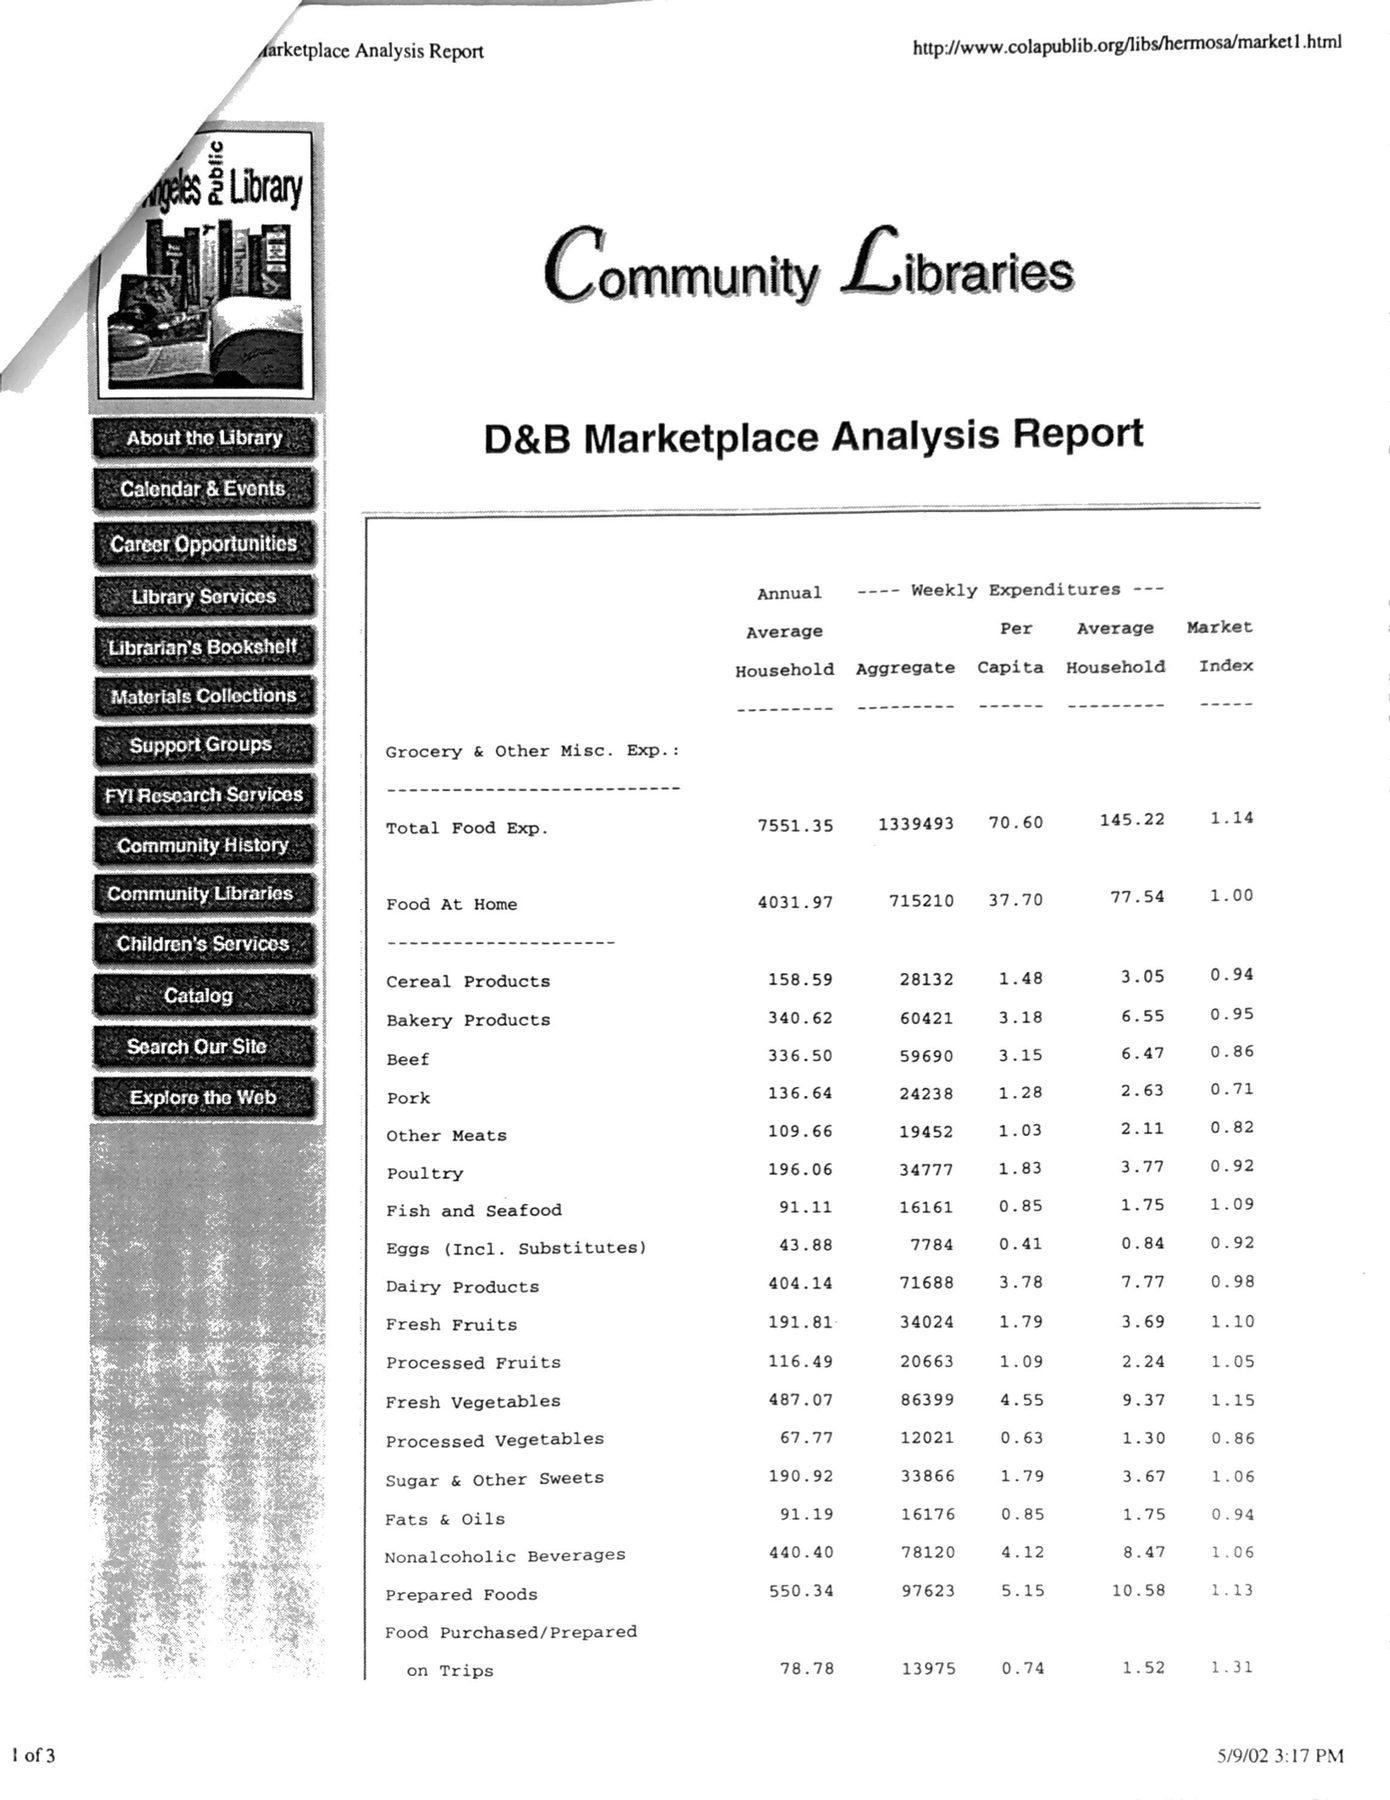
D&B Marketplace Analysis Report
Annual Average Household | Weekly Expenditures: Aggregate | Per Capita | Average Household | Market Index
Grocery & Other Misc. Exp.:
Total Food Exp. | 7551.35 | 1339493 | 70.60 | 145.22 | 1.14
Food At Home | 4031.97 | 715210 | 37.70 | 77.54 | 1.00
Cereal Products | 158.59 | 28132 | 1.48 | 3.05 | 0.94
Bakery Products | 340.62 | 60421 | 3.18 | 6.55 | 0.95
Beef | 336.50 | 59690 | 3.15 | 6.47 | 0.86
Pork | 136.64 | 24238 | 1.28 | 2.63 | 0.71
Other Meats | 109.66 | 19452 | 1.03 | 2.11 | 0.82
Poultry | 196.06 | 34777 | 1.83 | 3.77 | 0.92
Fish and Seafood | 91.11 | 16161 | 0.85 | 1.75 | 1.09
Eggs (Incl. Substitutes) | 43.88 | 7784 | 0.41 | 0.84 | 0.92
Dairy Products | 404.14 | 71688 | 3.78 | 7.77 | 0.98
Fresh Fruits | 191.81 | 34024 | 1.79 | 3.69 | 1.10
Processed Fruits | 116.49 | 20663 | 1.09 | 2.24 | 1.05
Fresh Vegetables | 487.07 | 86399 | 4.55 | 9.37 | 1.15
Processed Vegetables | 67.77 | 12021 | 0.63 | 1.30 | 0.86
Sugar & Other Sweets | 190.92 | 33866 | 1.79 | 3.67 | 1.06
Fats & Oils | 91.19 | 16176 | 0.85 | 1.75 | 0.94
Nonalcoholic Beverages | 440.40 | 78120 | 4.12 | 8.47 | 1.06
Prepared Foods | 550.34 | 97623 | 5.15 | 10.58 | 1.13
Food Purchased/Prepared on Trips | 78.78 | 13975 | 0.74 | 1.52 | 1.31
1 of 3 5/9/02 3:17 PM
Page 2
arketplace Analysis Report http://www.colapublib.org/libs/hermosa/market1.html
Food Away from Home: | 3519.37 | 624283 | 32.91 | 67.68 | 1.34
Other Misc. Expenses:
Alcoholic Beverages | 674.79 | 119697 | 6.31 | 12.98 | 1.61
Smoking Products & Supp. | 273.74 | 48557 | 2.56 | 5.26 | 0.74
Personal Care Prod/Svcs | 846.07 | 150080 | 7.91 | 16.27 | 1.24
Nonprescription Drugs | 169.41 | 30051 | 1.58 | 3.26 | 1.15
Housekeep/Garden Supply | 663.56 | 117706 | 6.20 | 12.76 | 1.13
The data contained on this page of Consumer Spending (CSP) are derived using information from the "Diary Portion" of the Consumer Expenditure Survey (CES), which is conducted by the Bureau of Labor statistics with the assistance of the Bureau of the Census.
The "Per Capita" data presented on this page is the weekly "Aggregate" divided by the total population for the area. The "Average Household" is the weekly aggregate divided by the total number of households. The "Annual Average Household Expenditure" is the weekly aggregate multiplied by 52 (weeks in a year) and divided by the number of households.
The "Market Index" (on this page) is the ratio of the weekly average households expenditures (WAHE) for the geography for which the report is being produced, compared to the "WAHE" for U.S. Total.
D&B Marketplace Analysis Report (Page 1) | D&B Marketplace Analysis Report (Page 2)
Household Trend Report | Back to Hermosa Beach Library Page
Household Trend Report Copyright © 1997 Claritas, Inc.
Revised 04/99
About the Library | Calendar & Events | Career Opportunities | Library Services | Librarian's Bookshelf
Materials Collections | Support Groups | FYI Research Services | Community History | Community Libraries
Children's Services | Catalog | Search Our Site | Explore the Web | Site Map
LIVE! REFERENCE 24 Hours a Day 7 Days a Week
2 of 3 5/9/02 3:17 PM
Page 3
arketplace Analysis Report http://www.colapublib.org/libs/hermosa/market1.html
Send us your comments and suggestions anytime or contact us at colapl@lhqsmtp.colapl.org.
Copyright © 2001 County of Los Angeles Public Library.
All Rights Reserved. Please read our disclaimer and privacy policy.
Developed by SAIC Internet Solutions.
3 of 3 5/9/02 3:17 PM
Show the original machine reading
Source scan page 55
Marketplace Analysis Report http://www.colapublib.org/libs/hermosa/market1.html
nigeles 2 Library
Community Libraries
About the Library
Calendar & Events
Career Opportunities
Library Services
Librarian's Bookshelf
Materials Collections
Support Groups
FYI Research Services
Community History
Community Librarios
Children's Services
Catalog
Search Our Site
Explore the Web
D&B Marketplace Analysis Report
Annual Weekly Expenditures ---
Average Per Average
Household Aggregate Capita Household
Market
Index
--
Grocery & Other Misc. Exp.:
Total Food Exp.
Food At Home
Cereal Products
Bakery Products
Beef
Pork
Other Meats
Poultry
Fish and Seafood
Eggs (Incl. Substitutes)
Dairy Products
Fresh Fruits
Processed Fruits
Fresh Vegetables
Processed Vegetables
Sugar & Other Sweets
Fats & Oils
Nonalcoholic Beverages
Prepared Foods
FoodPurchased/Prepared
on Trips
7551.35
4031.97
158.59
340.62
336.50
136.64
109.66
196.06
91.11
43.88
404.14
191.81
116.49
487.07
67.77
190.92
91.19
440.40
550.34
78.78
1339493
715210
28132
60421
59690
24238
19452
34777
16161
7784
71688
34024
20663
86399
12021
33866
16176
78120
97623
13975
70.60
37.70
1.48
3.18
3.15
1.28
1.03
1.83
0.85
0.41
3.78
1.79
1.09
4.55
0.63
1.79
0.85
4.12
5.15
0.74
145.22
77.54
3.05
6.55
6.47
2.63
2.11
3.77
1.75
0.84
7.77
3.69
2.24
9.37
1.30
3.67
1.75
8.47
10.58
1.52
1 of 3
1.14
1.00
0.94
0.95
0.86
0.71
0.82
0.92
1.09
0.92
0.98
1.10
1.05
1.15
0.86
1.06
0.94
1.06
1.13
1.31
5/9/02 3:17 PM
Source scan page 56
Marketplace Analysis Report
http://www.colapublib.org/libs/hermosa/market1.html
FoodAway from Home:
?- -
Other Misc. Expenses:
?---
Alcoholic Beverages
Smoking Products & Supp.
Personal Care Prod/Svcs
Nonprescription Drugs
Housekeep/Garden Supply
3519.37 624283 32.91 67.68 1.34
674.79
273.74
846.07
169.41
663.56
119697
48557
150080
30051
117706
6.31
2.56
7.91
1.58
6.20
12.98
5.26
16.27
3.26
12.76
1.61
0.74
1.24
1.15
1.13
The data contained on this page of Consumer Spending (CSP) are derived using
information from the "Diary Portion" of the Consumer Expenditure Survey
(CES), which is conducted by the Bureau of Labor statistics with the assistance
of the Bureau of the Census.
The "Per Capita" data presented on this page is the weekly "Aggregate" divided
by the total population for the area. The "Average Household" is the weekly
aggregate divided by the total number of households. The "Annual Average
Household Expenditure" is the weekly aggregate multiplied by 52 (weeks in a
year) and divided by the number of households.
The "Market Index" (on this page) is the ratio of the weekly average households
expenditures (WAHE) for the geography for which the report is being
produced, compared to the "WAHE" for U.S. Total.
D&B Marketplace Analysis Report (Page 1) | D&B Marketplace Analysis
Report (Page 2)
Household Trend Report | Back to Hermosa Beach Library Page
Household Trend Report Copyright © 1997 Claritas, Inc.
Revised 04/99
About the Library | Calendar & Events | Career Opportunities | Library Services | Librarian's Bookshelf
Materials Collections / Support Groups | FYI Research Services | Community History | Community Libraries
Children's Services | Catalog | Search Our Site | Explore the Web | Site Map
TUVEI REFERENCE
24 Hours a Day
7 Days a Week
2 of 3 5/9/02 3:17 PM
Source scan page 57
Marketplace Analysis Report http://www.colapublib.org/libs/hermosa/market1.html
Send us your comments and suggestions anytime or contact us at
colapl@lhqsmtp.colapl.org.
Copyright © 2001 County of Los Angeles Public Library.
All Rights Reserved. Please read our disclaimer and privacy policy.
Developed by SAIC Internet Solutions.
net Library?
Library
3 of 3 5/9/02 3:17 PM