Reports and proposals · 2005Estimated date
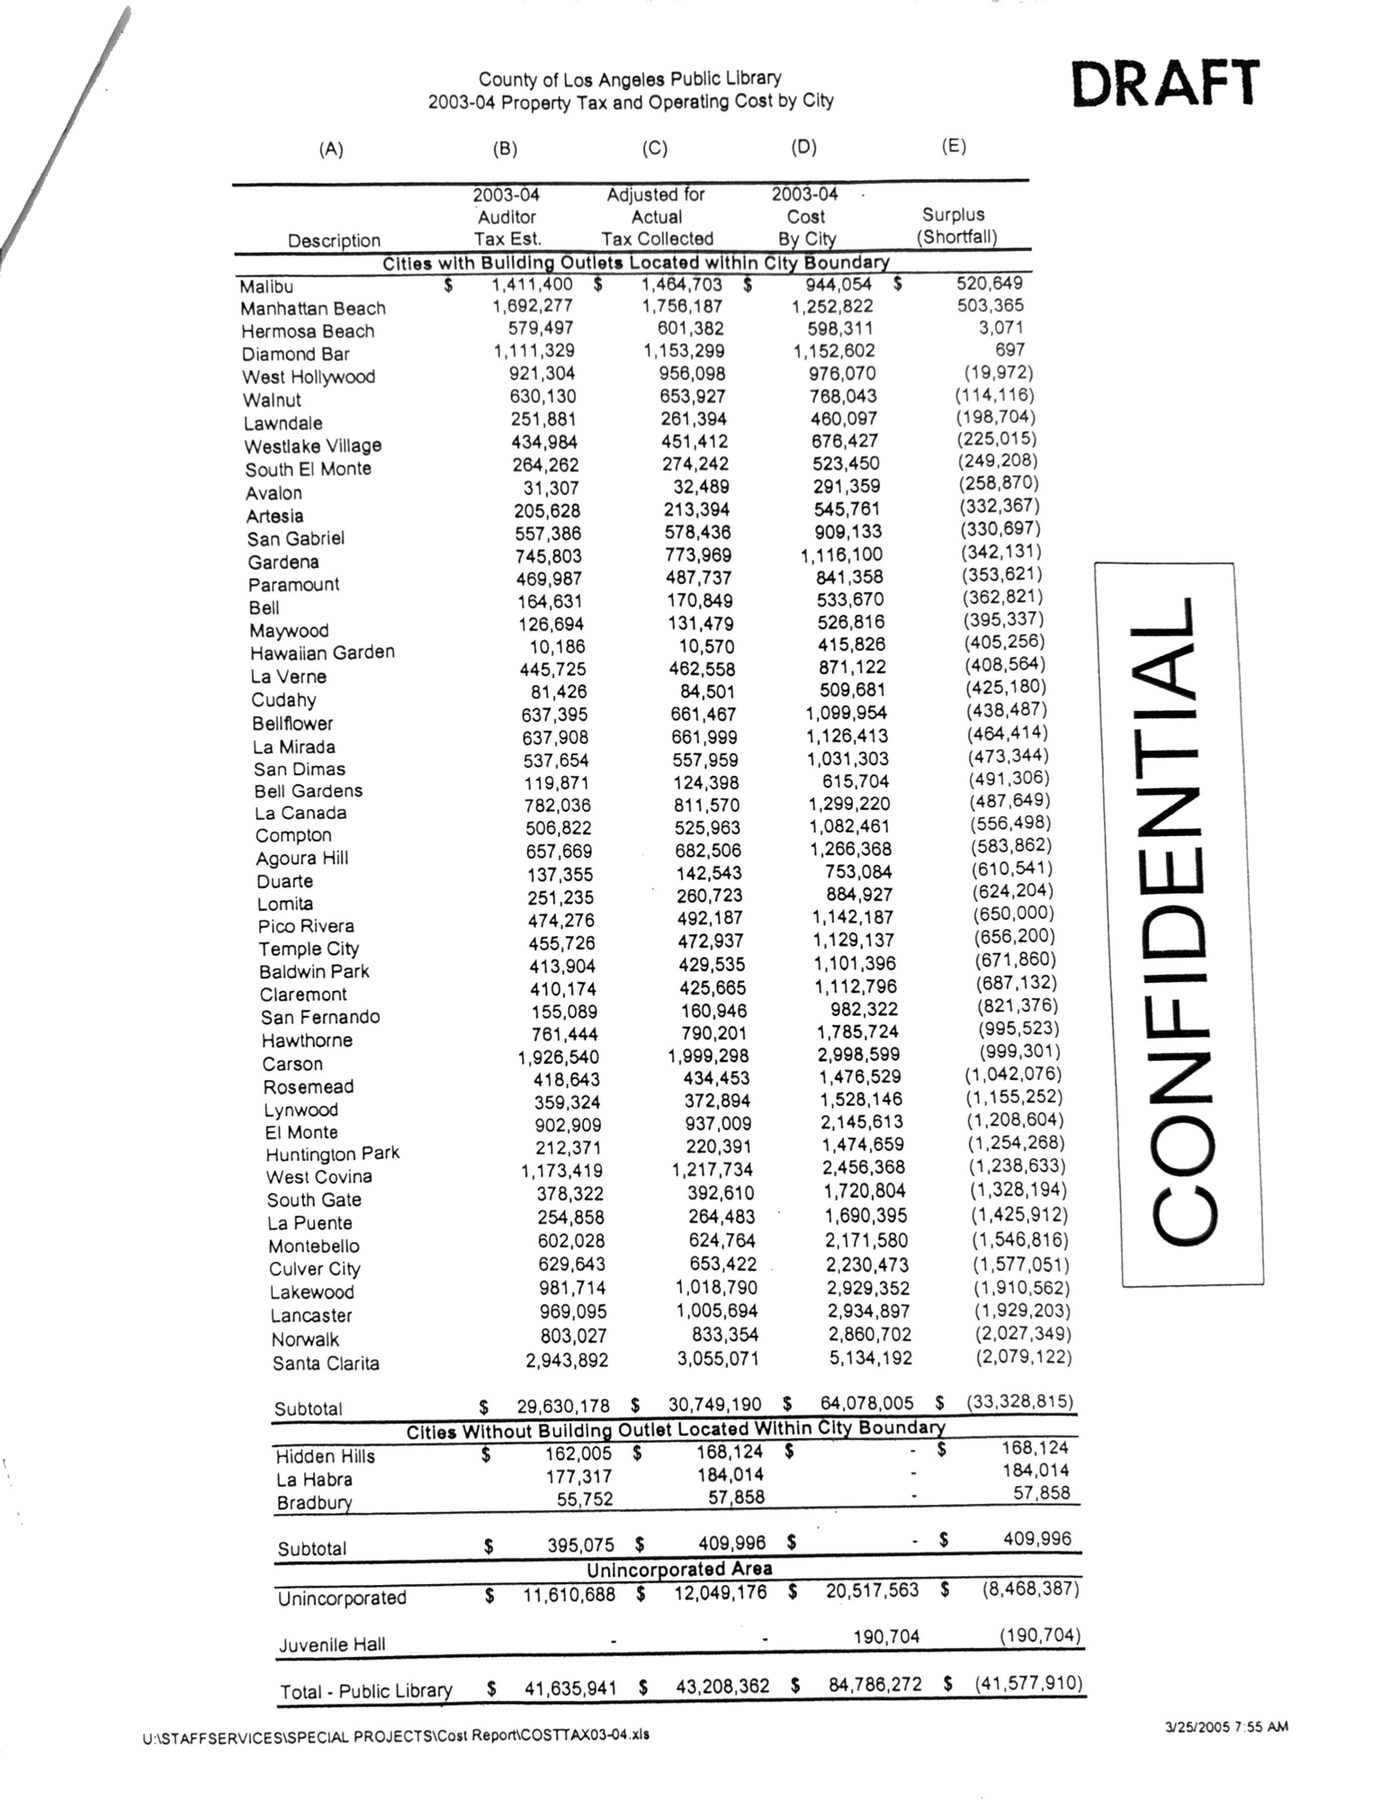
County comparison of 2003–04 library taxes and operating costs
Draft city table reports Hermosa tax contribution of $601,382, cost of $598,311 and surplus of $3,071. Other County documents print cost as $598,310, a one-dollar difference.
Text
Transcribed from the scans and checked against them by Claude. Typed text comes first; handwritten notes follow it. [illegible] marks words that cannot be read and [?] an uncertain reading.
County of Los Angeles Public Library
2003-04 Property Tax and Operating Cost by City
DRAFT
(A) | (B) | (C) | (D) | (E)
Description | 2003-04 Auditor Tax Est. | Adjusted for Actual Tax Collected | 2003-04 Cost By City | Surplus (Shortfall)
Cities with Building Outlets Located within City Boundary
Malibu | $ 1,411,400 | $ 1,464,703 | $ 944,054 | $ 520,649
Manhattan Beach | 1,692,277 | 1,756,187 | 1,252,822 | 503,365
Hermosa Beach | 579,497 | 601,382 | 598,311 | 3,071
Diamond Bar | 1,111,329 | 1,153,299 | 1,152,602 | 697
West Hollywood | 921,304 | 956,098 | 976,070 | (19,972)
Walnut | 630,130 | 653,927 | 768,043 | (114,116)
Lawndale | 251,881 | 261,394 | 460,097 | (198,704)
Westlake Village | 434,984 | 451,412 | 676,427 | (225,015)
South El Monte | 264,262 | 274,242 | 523,450 | (249,208)
Avalon | 31,307 | 32,489 | 291,359 | (258,870)
Artesia | 205,628 | 213,394 | 545,761 | (332,367)
San Gabriel | 557,386 | 578,436 | 909,133 | (330,697)
Gardena | 745,803 | 773,969 | 1,116,100 | (342,131)
Paramount | 469,987 | 487,737 | 841,358 | (353,621)
Bell | 164,631 | 170,849 | 533,670 | (362,821)
Maywood | 126,694 | 131,479 | 526,816 | (395,337)
Hawaiian Garden | 10,186 | 10,570 | 415,826 | (405,256)
La Verne | 445,725 | 462,558 | 871,122 | (408,564)
Cudahy | 81,426 | 84,501 | 509,681 | (425,180)
Bellflower | 637,395 | 661,467 | 1,099,954 | (438,487)
La Mirada | 637,908 | 661,999 | 1,126,413 | (464,414)
San Dimas | 537,654 | 557,959 | 1,031,303 | (473,344)
Bell Gardens | 119,871 | 124,398 | 615,704 | (491,306)
La Canada | 782,036 | 811,570 | 1,299,220 | (487,649)
Compton | 506,822 | 525,963 | 1,082,461 | (556,498)
Agoura Hill | 657,669 | 682,506 | 1,266,368 | (583,862)
Duarte | 137,355 | 142,543 | 753,084 | (610,541)
Lomita | 251,235 | 260,723 | 884,927 | (624,204)
Pico Rivera | 474,276 | 492,187 | 1,142,187 | (650,000)
Temple City | 455,726 | 472,937 | 1,129,137 | (656,200)
Baldwin Park | 413,904 | 429,535 | 1,101,396 | (671,860)
Claremont | 410,174 | 425,665 | 1,112,796 | (687,132)
San Fernando | 155,089 | 160,946 | 982,322 | (821,376)
Hawthorne | 761,444 | 790,201 | 1,785,724 | (995,523)
Carson | 1,926,540 | 1,999,298 | 2,998,599 | (999,301)
Rosemead | 418,643 | 434,453 | 1,476,529 | (1,042,076)
Lynwood | 359,324 | 372,894 | 1,528,146 | (1,155,252)
El Monte | 902,909 | 937,009 | 2,145,613 | (1,208,604)
Huntington Park | 212,371 | 220,391 | 1,474,659 | (1,254,268)
West Covina | 1,173,419 | 1,217,734 | 2,456,368 | (1,238,633)
South Gate | 378,322 | 392,610 | 1,720,804 | (1,328,194)
La Puente | 254,858 | 264,483 | 1,690,395 | (1,425,912)
Montebello | 602,028 | 624,764 | 2,171,580 | (1,546,816)
Culver City | 629,643 | 653,422 | 2,230,473 | (1,577,051)
Lakewood | 981,714 | 1,018,790 | 2,929,352 | (1,910,562)
Lancaster | 969,095 | 1,005,694 | 2,934,897 | (1,929,203)
Norwalk | 803,027 | 833,354 | 2,860,702 | (2,027,349)
Santa Clarita | 2,943,892 | 3,055,071 | 5,134,192 | (2,079,122)
Subtotal | $ 29,630,178 | $ 30,749,190 | $ 64,078,005 | $ (33,328,815)
Cities Without Building Outlet Located Within City Boundary
Hidden Hills | $ 162,005 | $ 168,124 | $ - | $ 168,124
La Habra | 177,317 | 184,014 | - | 184,014
Bradbury | 55,752 | 57,858 | - | 57,858
Subtotal | $ 395,075 | $ 409,996 | $ - | $ 409,996
Unincorporated Area
Unincorporated | $ 11,610,688 | $ 12,049,176 | $ 20,517,563 | $ (8,468,387)
Juvenile Hall | - | - | 190,704 | (190,704)
Total - Public Library | $ 41,635,941 | $ 43,208,362 | $ 84,786,272 | $ (41,577,910)
U:\STAFFSERVICES\SPECIAL PROJECTS\Cost Report\COSTTAX03-04.xls
3/25/2005 7:55 AM
Handwritten notes
• (right margin) CONFIDENTIAL stamp
Show the original machine reading
Source scan page 4
County of Los Angeles Public Library
2003-04 Property Tax and Operating Cost by City
(A) (B) (C) (D)
Description
Malibu
Manhattan Beach
Hermosa Beach
Diamond Bar
West Hollywood
Walnut
Lawndale
Westlake Village
South El Monte
Avalon
Artesia
San Gabriel
Gardena
Paramount
Bell
Maywood
Hawaiian Garden
La Verne
Cudahy
Bellflower
La Mirada
San Dimas
Bell Gardens
La Canada
Compton
Agoura Hill
Duarte
Lomita
Pico Rivera
Temple City
Baldwin Park
Claremont
San Fernando
Hawthorne
Carson
Rosemead
Lynwood
El Monte
Huntington Park
West Covina
South Gate
La Puente
Montebello
Culver City
Lakewood
Lancaster
Norwalk
Santa Clarita
2003-04 Adjusted for 2003-04
Auditor Actual Cost
Tax Est. Tax Collected By City
Citles with Bullding Outlets Located within City Boundary
1,411,400
$ 1,464,703 $ 944,054 $
1,692,277
1,756,187 1,252,822
579,497 601,382 598,311
1,111,329 1,153,299 1,152,602
921,304 956,098 976,070
630,130 653,927 768.043
251,881 261,394 460,097
434,984 451,412 676,427
264,262 274,242 523,450
31,307 32,489 291,359
205,628 213,394 545,761
557,386 578,436 909,133
745,803 773,969 1,116,100
469,987 487,737 841,358
164,631 170,849 533,670
126,694 131,479 526,816
10,186 ,57 415,826
445,725 871,122
81,426 509,681
637,395 1,099,954
1,126,413
9
3
1,031 ,303
119,871
782,036
506,822
657,669
137,355
251,235
474,276
8 615,704
811
525
682506
142, ,543
260,723
492, 187
47 72, ,937
42953
425,665
160,946
,201
1, ,299,220
1,082,461
266,,368
753
884,927
1.142,187
1,129,137
455,726
413,904
410,174
155,089
761,444
1,926,540
418,643
359,324
902,909
212,371
1,173,419
378,322
254,858
602,028
629,643
981,714
969,095
803,027
2,943,892
1,101,396
1,112,796
982,322
1,785,724
2,998,599
,453
372,894
937,009
220,391
1,217734
392,610
264,483
624,764
653,422
1,018,790
1,005,694
833,354
3,055,071
1.476.529
1,528,146
2,145,613
1,474,659
2,456,368
1,720,804
1,690,395
2,171,580
2,230,473
2,929,352
2.934,897
2,860,702
5,134,192
Subtotal
Hidden Hills
La Habra
$ 29,630,178 $ 30,749,190 64,078,005 $
Cities Without Building Outlet Located Within City Boundary
$ 162,005 $ 168,124 $
177,317 184,014
55,752 57,858
Bradbury
Subtotal $
395,075 $ 409,996
$
Unincorporated $
Unincorporated Area
11,610,688 $ 12,049,176
$ 20,517,563 $
Juvenile Hall 190,704
Total - Public Library$ 41,635,941 $ 43,208,362 84,786,272
U:ISTAFFSERVICESISPECIAL PROJECTSICost ReportICOSTTAX03-04.xls
DRAFT
(E)
Surplus
(Shortfall)
520,649
503,365
3,071
697
(19,972)
(114,116)
(198,704)
(225,015)
(249,208)
(258,870)
(332,367)
(330,697)
(342,131)
(353,621)
(362,821)
(405, ,256)
(408,564)
(425,180)
(438,487)
(464,414)
(473,344)
(491,306
(487, ,649
(556498)
(583,862
(610,541)
(624,204)
(650,000)
(656,200)
(671,860)
(687,132)
(821,376)
(995,523)
999,,301)
(1,042,076)
(1,155,252)
(1208,604)
(1,254,268
(1,238,633)
(1,328,194)
(1,425,912)
(1,546,816)
(1,577,051)
(1,910,562)
(1,929,203)
(2,027,349)
(2,079,122)
(33,328,815)
168,124
184,014
57,858
409,996
(8,468,387)
(190,704)
(41,577,910)